(JNJ) Johnson & Johnson
A Mega Cap with Long-Term and Dividend Appeal

Hello Fellow Patriots,
If you've ever looked at your portfolio and wished at least one holding would just act normal, Johnson & Johnson (JNJ)is the kind of stock that often fills that role. It's a mega-cap healthcare business that many investors treat like the "steady ship" in rough seas.
As of mid-February 2026, JNJ is trading around $243 to $244. The recent run has been strong. In the dataset I'm using, it's up about +11% over the past month and +26% over the past three months. Some public snapshots show smaller gains over the same window, so I focus on the bigger point: momentum has been clearly positive lately.
In this post, I'm keeping it simple. I'm looking at JNJ the way I do when I'm thinking long term, with dividends in mind, while still respecting what the chart is saying today. Before I buy, I always re-check the current dividend yield and scan for major company updates that could change the story.
What JNJ is, and why investors keep coming back to it
Johnson & Johnson sits in the healthcare sector, with major operations tied to medicines and health-related products. For me, the appeal is not mystery. It's that healthcare demand tends to stick around in good markets and bad ones. People don't stop needing treatments because the economy slows.
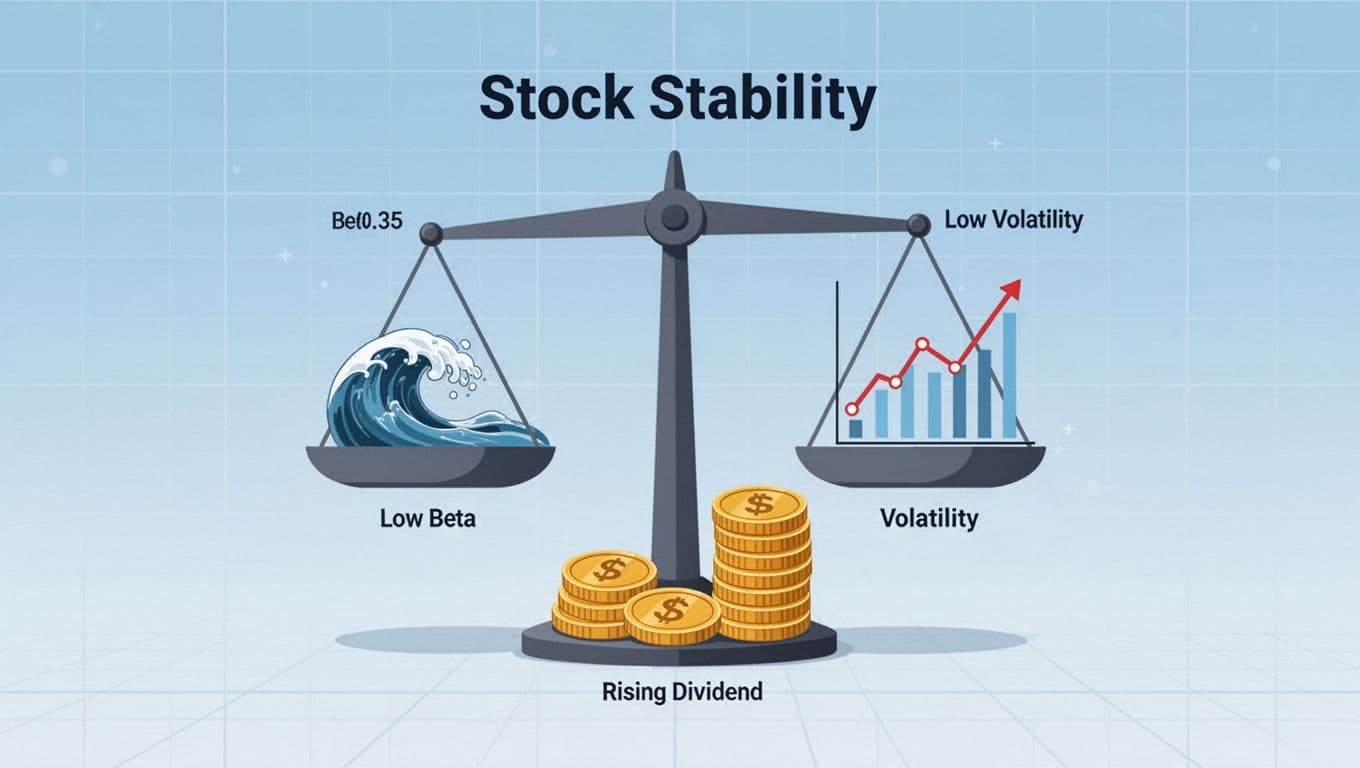
When I think about JNJ as an investment, I think about stability first. The risk stats back that up. A beta around 0.35suggests the stock has moved much less than the broader market in many periods. Annual volatility around 14.8% also points to a smoother ride than plenty of popular growth names. That doesn't guarantee safety, but it can help me sleep at night when headlines get noisy.
I also like that JNJ is large enough to absorb hits better than smaller peers. Size does not make a company perfect, yet it often brings advantages: scale in research, distribution, and the ability to fund long projects. In other words, it's not usually a one-product story.
Finally, JNJ fits a certain mindset. If I'm trying to build a portfolio that can pay me while I wait, a reliable dividend payer can matter just as much as price gains. JNJ is often viewed that way by income-focused investors, although I still verify what I'm actually getting today.
The simple bull case: steady business, steady demand, and a dividend many people rely on
My bull case for JNJ is straightforward. Healthcare is not a trend, so demand doesn't vanish overnight. Because the company is huge and diversified, I'm not depending on a single product to carry my results.
The dividend is another reason people own it. The yield in the data I'm looking at is about 2.14% (other quotes show about 2.10% at roughly the same price). Since yield moves with price, I always confirm the current number before I buy.
The simple bear case: big companies still face surprises
On the other hand, "steady" does not mean "no problems." Big healthcare companies can face sudden headlines, legal issues, product setbacks, and policy changes. Competition can also chip away at margins over time. Even valuation risk matters, because paying too much for safety can still hurt returns.
I keep one rule in mind: stability lowers some risks, but it never removes risk.
My quick read on JNJ's numbers and ratings (Patriot Roundtable tables included)

When I'm evaluating JNJ, I like a quick "dashboard" view before I get lost in details. In the numbers I reviewed, market sentiment comes across moderately bullish, and the stock earns an A- style market rating around the mid-70s on a 100-point scale. Separately, the quantitative score I saw reads as Strong Buy, with an overall score around 83/100. I don't treat any rating as a command, but it helps me frame what the market is rewarding right now.
I also look at the factor breakdown because it answers a simple question: What is powering the stock today? Here's how I interpret the main factors in plain English:
- Valuation: How expensive the stock looks based on common ratios.
- Growth: How fast revenue and earnings appear to be improving.
- Profitability: How well the company turns sales into profit (margins matter).
- Momentum: Whether the price trend has been strong recently.
- Financial health: Balance sheet strength, debt levels, and liquidity.
In this dataset, profitability looks strong (profit margin is listed around 28.5%). The P/E ratio is around 22 and forward P/E is around 19.41 in the same source, which suggests the market expects steady performance, not explosive growth. For a large healthcare name, that feels reasonable to me, but I still compare it to its own history when I'm deciding what price I'll pay.
Ratings are helpful as a snapshot, but I still want to know what could break the story, and what price I'm paying for "quality."
Table: Patriot Roundtable Quantitative Analysis (what the score is really saying)
Here's the factor view exactly the way I like to scan it, quick and readable.
| Category | Score / Grade |
|---|---|
| Overall Quant Rating | Strong Buy |
| Overall Score | 83/100 |
| Valuation | 81/100 (A) |
| Growth | 83/100 (A) |
| Profitability | 88/100 (A) |
| Momentum | 90/100 (A+) |
| Financial Health | 69/100 (B+) |
- What looks strongest: Momentum and profitability stand out, which matches the recent uptrend.
- What looks weakest: Financial health is still solid, but it's the lowest factor here (B+).
- What I'd double-check before buying: debt trends, the next earnings date and guidance, and whether any recent news changes the risk picture.
Table: Patriot Roundtable Market Analysis snapshot (fast facts I care about)
This is the quick set of stats I usually pin to the top of my notes.
| Metric | Value |
|---|---|
| Current price | $243.45 |
| Market cap | $586.69B |
| P/E | 22.07 |
| Dividend yield | 2.14% |
| Profit margin | 28.5% |
| Forward P/E | 19.41 |
| Trend | Uptrend |
Different sources sometimes show different market caps and yields on the same day. Because of that, I focus on direction and consistency, then I verify the key items (price, yield, and any major updates) right before I place an order.
What the chart is hinting at, and how I manage timing risk
Even though I'm a long-term investor, I don't ignore timing. Paying attention to the chart can save me from buying right after a sprint.
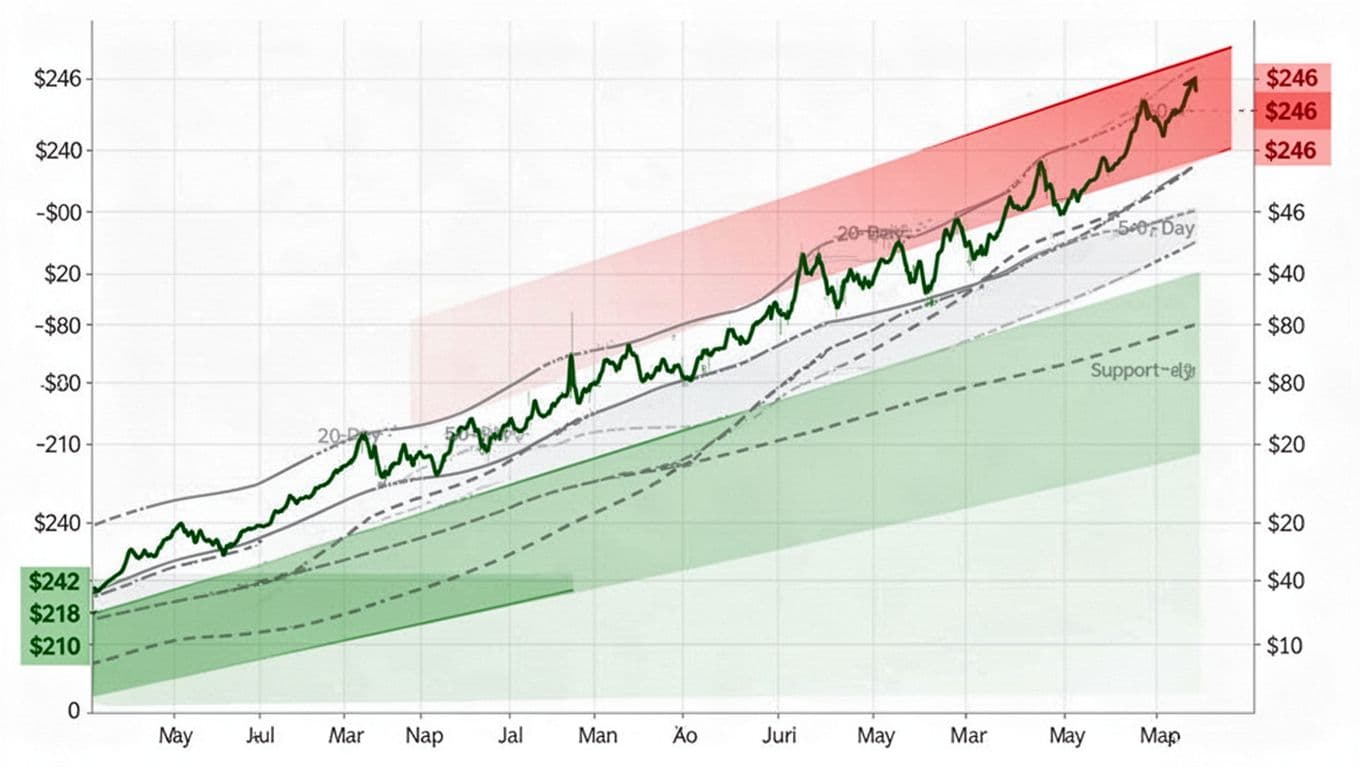
In the technical read I reviewed, JNJ is in an uptrend and trading above rising 20-day and 50-day moving averages(around $230 and $216 in that snapshot). That's usually a healthy sign. The MACD signal also reads bullish, which often lines up with continuing strength.
At the same time, the RSI is around 88.7, which is very high. In plain terms, RSI measures how stretched a move might be. When RSI gets that hot, it often means buyers have been aggressive, and the stock may need to cool off. That cooldown can be sideways action, a small pullback, or a sharper dip. No one can call the exact shape in advance.
Key levels matter here because they can shape my plan. Resistance was noted around $246.35, and support was listed around $210.50 in the same technical set. The average true range (ATR) was around $3.86, or roughly 1.58%, which helps me gauge day-to-day wiggles. Also, the overall trading signal in that snapshot was Hold, basically saying, "Nice trend, but wait for cleaner confirmation."
When a stock is strong but overbought, I think less about prediction and more about having a plan.
Overbought does not mean 'sell now', it means 'plan your entry'
An RSI near 88 does not force me to sell. Instead, it pushes me to avoid the most common mistake: buying a great company at the exact moment everyone else is chasing it.
When JNJ looks stretched, I usually pick one of these entry styles:
- I buy in small pieces over a few weeks, so one bad day doesn't ruin my entry.
- I wait for a pullback, even a modest one, then re-check the trend.
- I set a limit order at a price I'd feel good about, then let the market come to me.
Risk controls can help too, even for long-term investors. In the dataset, a suggested stop loss level was around $235.73, with example upside targets near $255.62 (5%) and $267.79 (10%). I treat these as planning tools, not promises. Stocks don't respect my targets just because I wrote them down.
My checklist before I buy JNJ shares (or add more)
Before I add JNJ, I keep it simple and repeatable:
- I confirm the current dividend yield and look at payout safety.
- I read the latest earnings notes and any guidance changes.
- I sanity-check valuation, using P/E as one input, not the only one.
- I scan for major company headlines (legal, product, policy).
- I choose my time horizon upfront (years, not weeks).
- I set my position size so one stock can't dominate my portfolio.
Conclusion
JNJ looks like what many investors want in 2026: a lower-volatility healthcare stock (beta about 0.35, volatility around 14.8%) with a reasonable dividend (around 2.1% to 2.14%, depending on the quote) and strong recent momentum. Still, the chart is sending a caution flag. An RSI near 88.7 and resistance near $246.35 suggest the stock may be a bit overheated in the short run.
So what would I do next? I'd keep JNJ on my watchlist, then either buy in small slices or wait for a pullback or clearer confirmation. Most importantly, I'd re-check the dividend and any fresh company updates right before I act. This article is educational, not financial advice, and my goal is to help you build a plan you can stick with when the market gets loud.
When you subscribe to the blog, we will send you an e-mail when there are new updates on the site so you wouldn't miss them.