(SSRM) SSR Mining Inc.
A Real World Asset Base Investors Are Buying Into
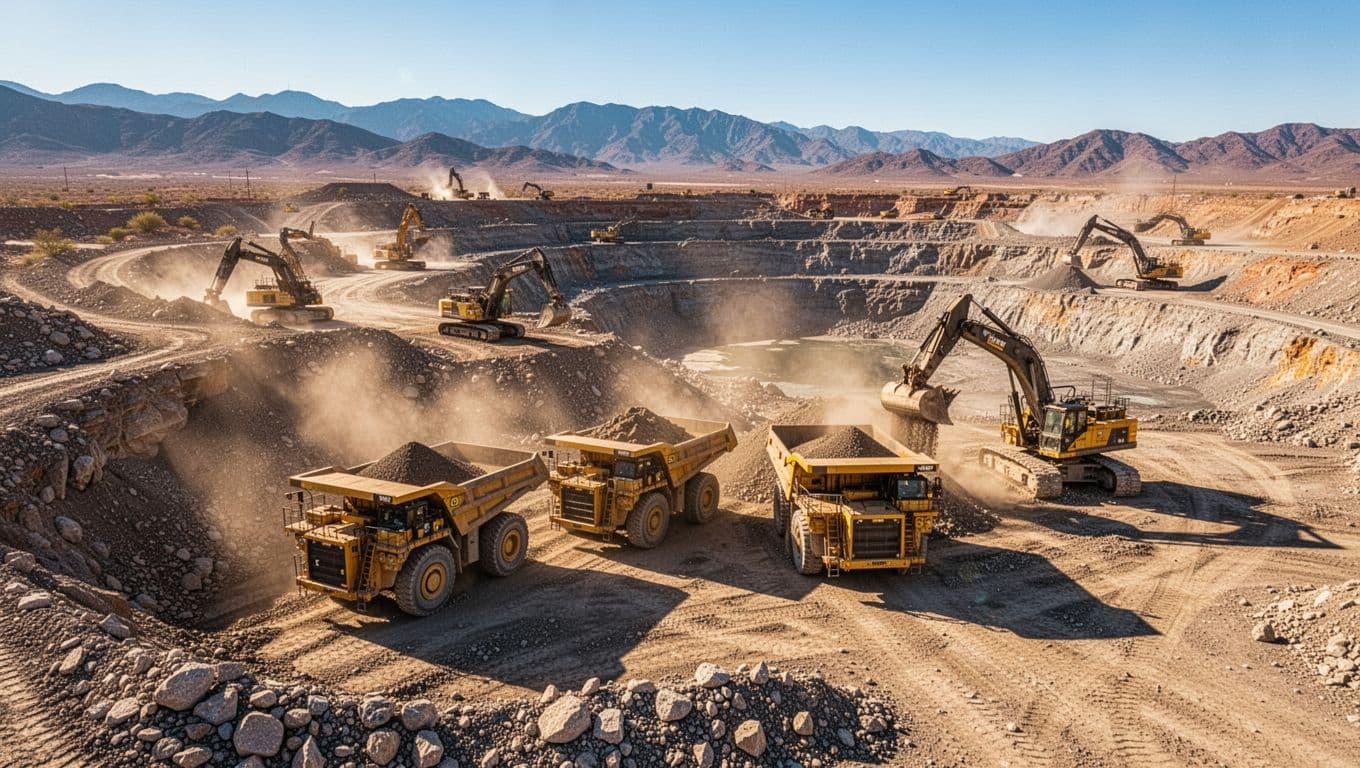 An open-pit gold mining scene that mirrors the kind of real-world asset base investors are buying into with mining stocks.
Hello Fellow Patriots,
(SSRM) SSR Mining Inc. is the kind of stock that can feel calm one week, then sprint the next. It's a precious metals miner (gold first, plus other metals) with operating sites in the US, Canada, and Argentina, and the share price has moved fast in early 2026.
When I look at a miner like SSRM, I try to keep it simple. I use Patriot Roundtable Analysis style factor scores to ground the story, then I check basic technical levels to avoid guessing. The data I'm referencing shows strong recent performance (including a big 1-month move and an even stronger 3-month trend in some snapshots), bullish sentiment readings around 85 out of 100, and a clear warning label: this is a high-risk stock with annual volatility around 60%. Mining stocks can reward patience, but they can also punish sloppy position sizing.
What SSR Mining does and why its mine mix matters for SSRM investors
 Mining is global by nature, and jurisdiction can matter as much as geology.
SSR Mining is a precious metals mining company. In plain terms, it pulls metal out of the ground and sells it, with gold as the main driver and additional exposure to silver, lead, and zinc. The stock trades as SSRM on Nasdaq in the US and also trades on the TSX in Canada.
That "mine mix" matters more than people think. Miners don't sell software subscriptions. They operate heavy equipment, manage crews, deal with weather, and follow permits that can change. One site can run smoothly while another hits a snag. As a result, SSRM's results can hinge on where its mines sit and how stable those locations are.
When I evaluate SSRM's footprint, I think in a few buckets:
- Costs and energy: Power, labor, and fuel hit margins fast.
- Permitting and rule changes: Mines operate at the mercy of regulators.
- Weather and logistics: Remote sites can slow down in winter or storm seasons.
- Country risk: Politics and currency can shape cash flow even if production stays steady.
In other words, SSRM isn't just "a gold stock." It's a portfolio of operating systems spread across different places, each with its own failure points.
A quick tour of SSRM's main operating mines (Marigold, CC&V, Seabee, Puna)
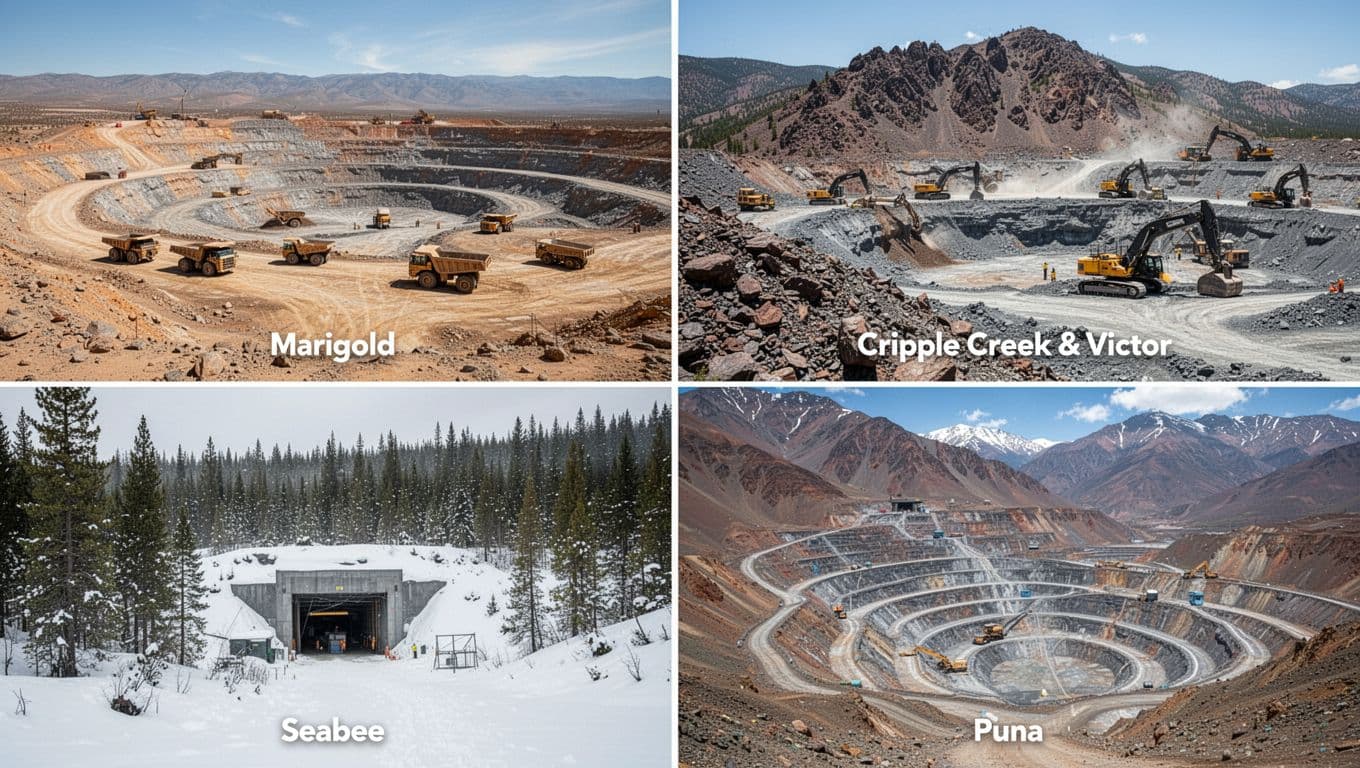 Four very different operating environments, which helps explain why mining results can vary quarter to quarter.
Here's the simple map in my head when I'm tracking SSRM:
- Marigold (United States): I watch production consistency and cost control, since open-pit operations can swing with grades and waste movement.
- Cripple Creek and Victor, CC&V (United States): I focus on the life-of-mine plan updates and whether expansion work stays on budget.
- Seabee (Canada): I keep an eye on safety and steady throughput because remote conditions can tighten logistics and staffing.
- Puna (Argentina): I watch jurisdiction and currency risk along with operating stability, since country-level shifts can affect cash flow quickly.
None of this requires deep geology. I just want to know if each site is producing reliably, keeping people safe, and staying inside cost guardrails. Over time, those basics tend to show up in margins and free cash flow.
Hod Maden, the growth project that could change SSRM's long term story
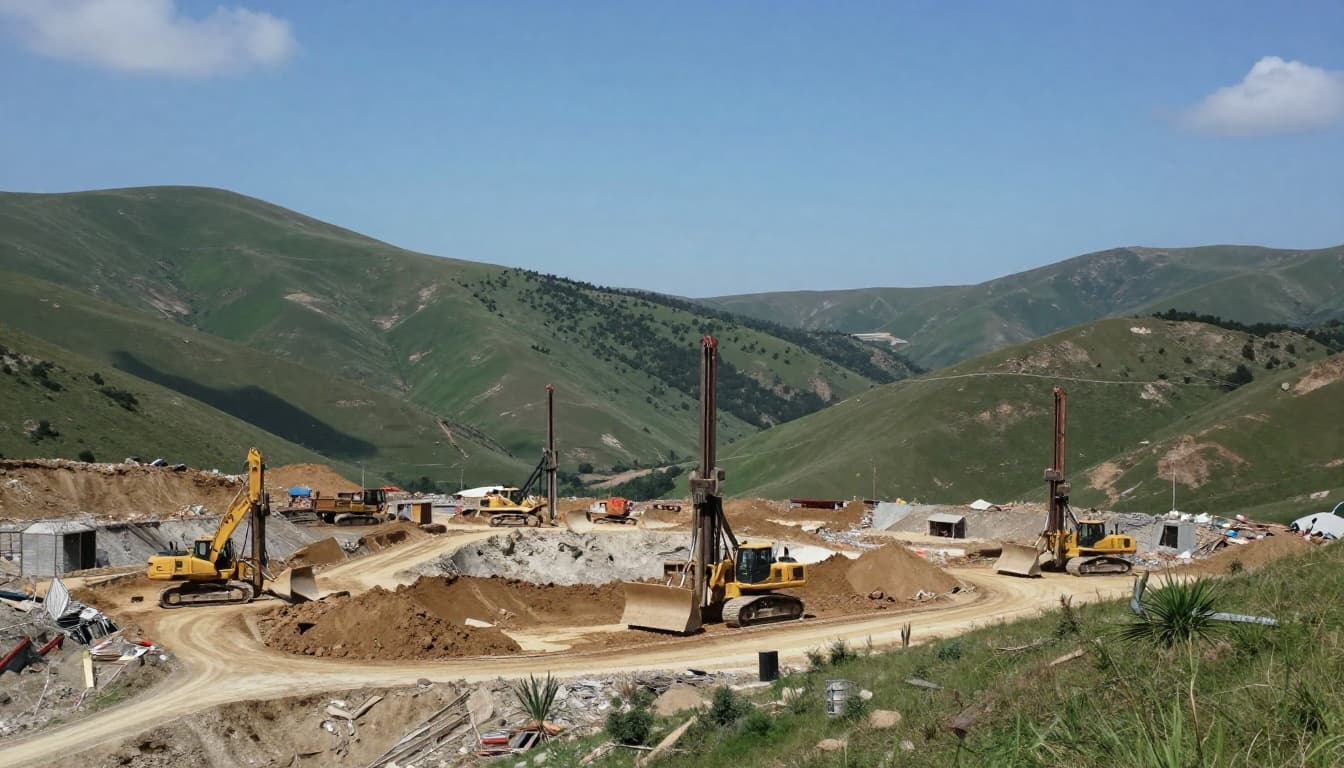 A development-stage mine site concept, where the biggest upside often comes with the biggest execution risk.
Hod Maden is the project I treat as SSRM's "next chapter" option. A technical report published in late January 2026 described strong project economics on paper, including an estimated net present value (NPV) around $1.66 billion (at a 5% discount rate) and an estimated internal rate of return (IRR) around 39%. Those numbers can be exciting, but I keep them in the right box: they're model outputs based on assumptions like metal prices, costs, timelines, and build quality.
Here's how I translate the jargon:
- NPV is the value today of expected future cash flows, after discounting for time and risk. A higher NPV suggests more value if the plan works.
- IRR is the implied annual return of the project cash flows. A higher IRR suggests stronger economics, assuming the build and ramp-up go well.
Still, mines aren't built in spreadsheets. Delays happen. Costs can rise. Permits can take longer. Even a great project can disappoint if execution slips. So I watch for concrete milestones, not just optimistic tables.
My rule is simple: project economics matter, but real progress (budget, schedule, permitting, and early works) is what earns trust.
Patriot Roundtable Analysis for SSRM, the scorecard I use to sanity check the hype
 A calm, method-first way to look at a volatile stock.
This is where Patriot Roundtable Analysis helps me stay honest. I treat it like a factor-based snapshot that lets me compare SSRM against itself over time. It doesn't predict the future, but it does highlight what's working right now (and what might be fragile).
Below is the scorecard data I'm using for this February 2026 snapshot.
| Factor | Grade | Score |
|---|---|---|
| Overall | A | 87/100 |
| Valuation | A | 82/100 |
| Growth | A+ | 100/100 |
| Profitability | A- | 72/100 |
| Momentum | A+ | 97/100 |
| Financial Health | A | 85/100 |
Next, I like to pin the basic context in one place. These figures can shift depending on timing and the data source, especially after sharp price moves.
| Metric | Snapshot value |
|---|---|
| Price | $28.11 |
| Market cap | $5.73B |
| P/E ratio | 27.29 |
One quick reality check: real-time market feeds around mid-February 2026 also showed SSRM closing closer to the mid-$20s with a different market cap range and a P/E in the low 20s. That gap doesn't mean someone's lying. It usually means different timestamps and different earnings methods (trailing vs adjusted vs forward). I keep that in mind before I anchor to any single number.
SSRM stock momentum and risk, how I'd frame an entry plan without guessing
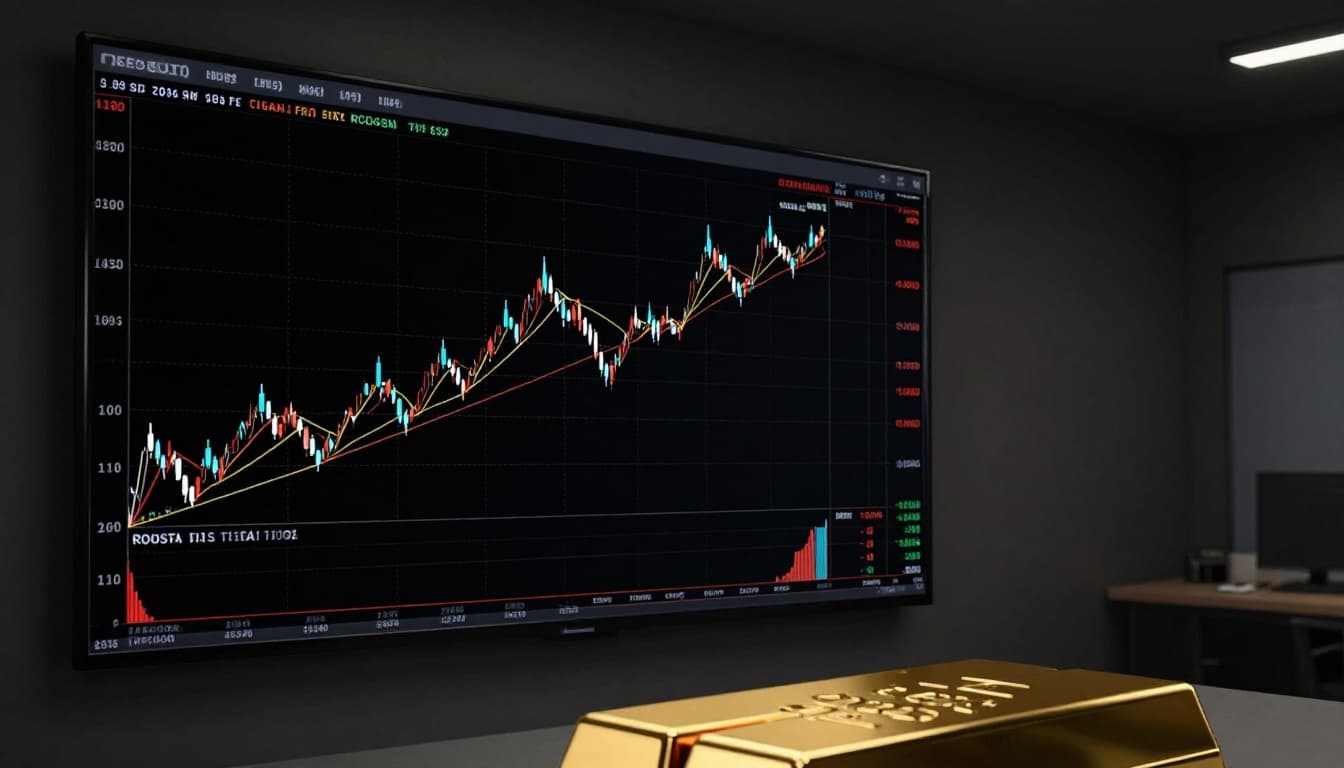 Technical levels can help plan risk without trying to predict tomorrow's headline.
The cleanest part of the SSRM story right now is price action. The technical snapshot I'm using shows an uptrend, a neutral RSI near 52.8 (so it's not flashing "overbought"), and a bullish MACD. It also shows the price trading above rising 20-day and 50-day moving averages (with those averages around the mid-$20s in that snapshot).
I frame the key chart levels like this:
- Resistance around $28.81: a zone where sellers may show up.
- Support around $22.45: a zone where buyers previously defended.
Now the warning label. SSRM is flagged as high risk. The same dataset shows ATR around $1.91 (about a 6.8% typical move) and annual volatility around 60.4%. That's not a small detail, it's the whole game. Big volatility can create opportunity, but it also means stops can get hit during normal noise.
The beta is listed around 0.54 in the snapshot, which might sound "low." For miners, beta can mislead. Gold can jump on macro news, miners can gap on operational updates, and those moves don't always track the broad market neatly.
Here are example planning levels shown in the same risk tool view. I treat these as a structure, not a promise.
| Planning level | Price |
|---|---|
| Example stop loss | $24.28 |
| Example target 1 (about 5%) | $29.52 |
| Example target 2 (about 10%) | $30.92 |
If I'm interested in SSRM, I'd rather plan around support, resistance, and position size than argue with myself about the "perfect" entry.
Who SSRM tends to fit, and who should probably pass
 Two valid approaches to a high-swing stock, depending on risk tolerance.
From what I see in the data, SSRM tends to fit investors who are bullish on gold (or want mining exposure) and can handle sharp swings. It also tends to fit people with a longer time horizon, because miners can look "cheap" for a long time before the market agrees.
On the other hand, if you're risk-averse, SSRM's volatility profile can be a deal-breaker. Volatility around 60% is not a footnote. It's a lifestyle.
Before buying, I run a quick self-check:
- Time horizon: Can I hold through ugly quarters without panic selling?
- Drawdowns: Am I mentally ready for fast drops that feel unfair?
- Diversification: Will this be a small slice, not the whole meal?
- Due diligence: Have I read enough to understand the mines and the risks?
If I can't define my downside before I buy, I'm not investing, I'm just hoping.
Conclusion
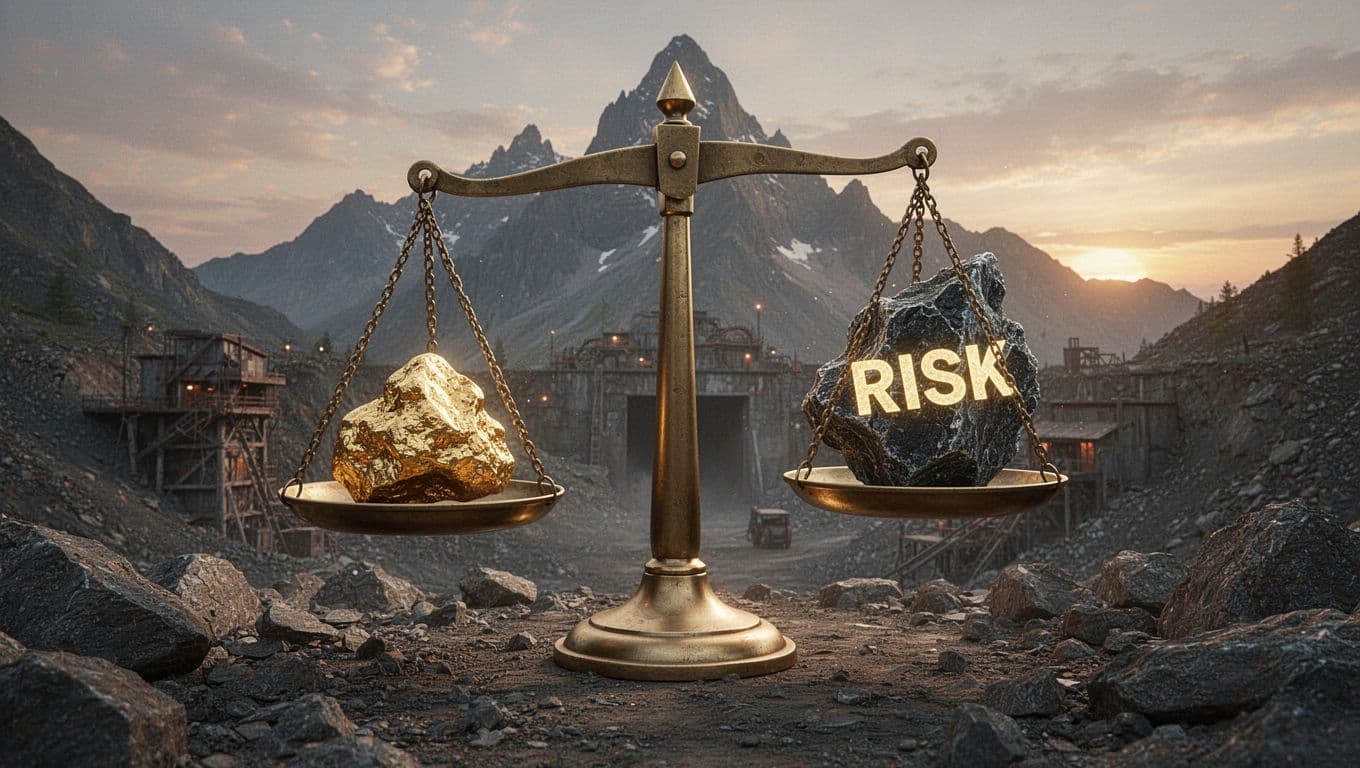 Mining stocks often feel like a constant trade-off between upside and risk.
When I step back, I see SSRM as a stock with real momentum and a strong scorecard, but it's still a miner tied to gold prices and execution. The Patriot Roundtable-style factors look impressive (especially growth and momentum), and sentiment readings have been bullish, yet the volatility risk is high and never goes away. I'm also watching the calendar because full-year 2025 results are expected February 17, 2026, and earnings can reset the story fast.
My simple action list is to track Hod Maden updates, watch costs and margins, monitor debt and liquidity, and pay attention to how SSRM behaves near resistance and support. Above all, I treat position size as the main risk tool, because volatility doesn't care about my conviction. In the end, I only take exposure I can afford to ride through big swings.
When you subscribe to the blog, we will send you an e-mail when there are new updates on the site so you wouldn't miss them.